Speed. It’s an important factor in the recent Olympics, the Paralympics and even our day to day lives. Speed is also an important factor when it comes to Google. Their ethos concerns the provision of accurate, relevant search results delivered as quickly as possible to the user. To quote their Webmaster Guidelines:
“Monitor your site’s performance and optimize load times. Google’s goal is to provide users with the most relevant results and a great user experience. Fast sites increase user satisfaction and improve the overall quality of the web …”
We’re going to take a look at some factors and tools that you can use to monitor, identify site speed issues and some quick wins you can look at getting now.
Webmaster Tools
Got access to Webmaster Tools? Yes? Great stuff. No? Go get it kiddo. I highly recommend you make sure you sign up for and setup Google Webmaster Tools for your site. Big G is really good at updating its features and carefully used it can become a genuine line of communication between you and the giant search engine.
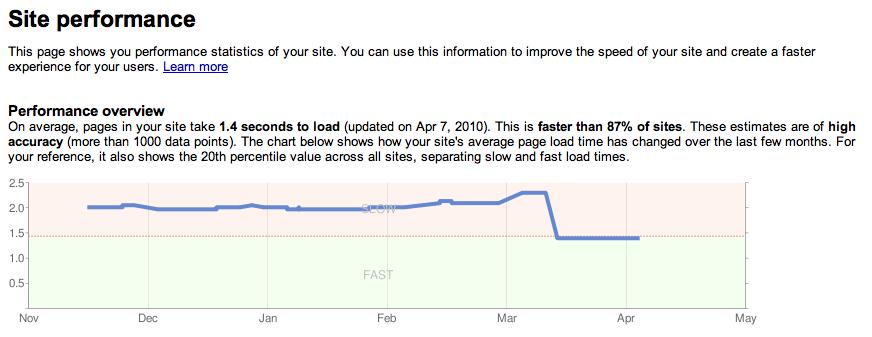
The above is a screen shot from Google’s Webmaster Central Blog showing the graph they produce for a website so you can see site performance historically.
Analysing your site speed
Apart from Google’s own site speed performance charts as above, there are a myriad of available tools you can use to track and analyse the current speed of your website. Here are a few and they’re all free.
Page Speed – Recommended by Google, open source Firefox and Firebug plugin that evaluates performance available on Google Developers site.
YSlow – A plugin from Yahoo that provides some great analysis on page and gives recommendations on speeding things up.
A few personal preferences:
Pingdom – Great websites that gives you a complete breakdown of what’s taking time to download. When you look at the completed report, it’s really easy to pick out problem items and focus your attention on specific HTML requests that are causing lag.
GTmetrix – Another nice website that shows you what’s lagging and provides an at-a-glance ‘grade’ on your site’s performance based on the request. It then provides individual grades against optimisation recommendations so you can again prioritise specific tasks to enable you to catch that whizzy Gonzales.
A few quick wins
So now you’re armed with everything you need to start checking and keeping tabs on your site’s load time. From the tools above, you should also get some good recommendations to implement from the feedback the tools give you. However, below are some quick wins that you can probably implement now:
Image Optimisation
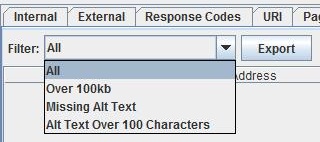 Definitely one of the more common culprits to a lagging website is ma-husive images squeezed into tiny window like a marshmallow in a thimble. Identify the images on your site that are really too large for what they’re being used for. No image on a normal website should be larger than about 100kb. If they are, there’s room to move. How do you identify them? My preference is to use what we at Vertical Leap term the SCROG – Screaming Frog SEO Tool. Crawl the website you want to identify large images for (the free version has a limit of 500 URI limit) and once complete, look at the images tab, hit the drop down and you can export all image addresses that are above 100kb.
HTTP requests
The more requests a browser requests to a server, the more load it’s put under to perform. In turn, this can have detrimental effects on the loading speed of your pages. This is a particularly common issue with Content Management Systems that have a myriad of plugins or extensions. Take a look at the below:
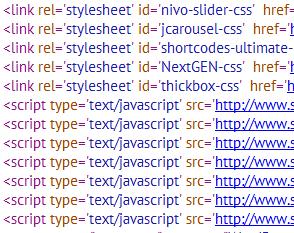
JavaScript and CSS are the main culprits time and time again. In the above the browser has to make 12 requests to the server to completely render the page and the functionality. To remedy the problem all you have to do is reduce the number of HTTP requests being made by combining files. Put all your CSS into one single file, do the same with your JS (just watch out for conflicts).
Server compression GZip
GZip compression is a server side method of squishing resources on your website into smaller files. When they’re requested, it takes less to squeeze them down the pipeline to the user’s browser. It can make quite a considerable amount of difference in doing so, for example, JS files can be reduced by 70% or more when they undergo compression. When you have lots of JS files and they all get squashed to such a degree; that’s quite a big impact on loading times.
You can enable GZip compression on Apache it depends on what version you’re using. You’ll either be using the ‘mod_gzip’ module or the ‘mod_deflate’ module. For you IIS folks you’ll be using the interface for “web site properties” depending on whether you’re an IIS 6 or 7 dude or dudette. However, I’m much more unfamiliar with IIS than I am Apache so here’s a useful article on enabling compression in IIS. I’m not going to leave the Apache peeps hanging with a link, so here’s a pretty good guide on doing the same with lovely Apache (biased, much?).
And there we go. Go forth and catch that Speedy Gonzales! AKA – optimising site speed for Google. Remember to add any additional suggestions in the comments!